Recently, we announced that we’re working to improve the online video analytics dashboards in our platform. These improvements give you easier access to the data that helps you run your business. We’re happy to tell you that the second phase of the overhaul has just been released. We’ve improved both sections of the Projects dashboard: Performance and Flow Analysis. The Projects analytics provide you with more insight into the performance of your interactive videos than before.
The first thing you’ll notice is that the design has a refreshed look and feel that’s in line with the new design for all analytics dashboards–But that’s just the beginning. Let’s dive into the changes and how these improved dashboards allow you to analyse your interactive videos even faster.
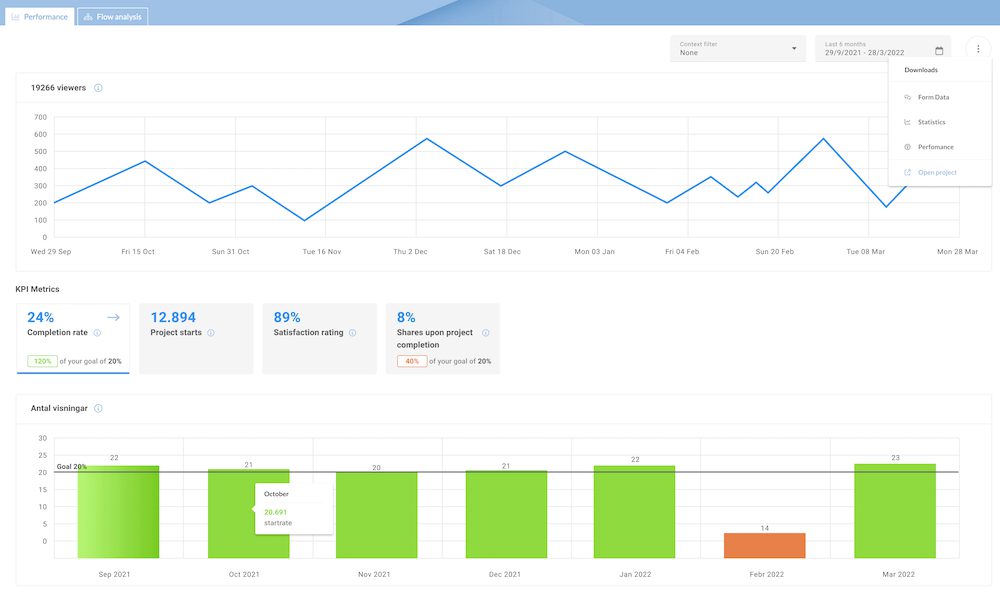
Performance
Share insights
Give your colleagues and stakeholders insight into how your interactive videos are performing. Simply set a date range and get ready to download any of the following: form data, statistics and performance overview.
- Form data gives you a list of all the form submissions received via an interactive video, including any information viewers filled in.
- Statistics data allows you to download Flow Analysis data, showing you the number of views per clip.
- Performance data gives you an overview of your custom KPIs and shows you whether you’re on your way to achieving your goals.
Track your progress in an instant
We’ve adjusted the KPI metrics to enable you to see your video performance in a single glance. You’ll see how your video is performing and whether or not you’re on track to hit your goals. If you’re seeing orange numbers, you may need to make some small adjustments to your interactive video. Nothing but green on your dashboard? Well done, you’re reaching your goals with ease.
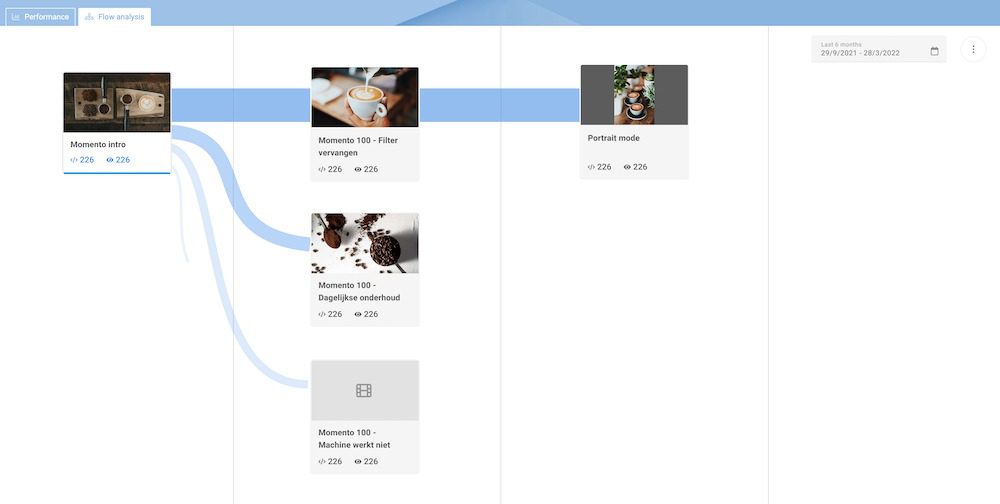
Flow analysis
Less is more. That’s why we’ve streamlined and simplified the Flow Analysis dashboard, making it even more user-friendly than before. On the main screen, you’ll find a quick overview with the most relevant information and you can click on any individual clip for an in-depth analysis.
What’s next?
We’d love for you to check out your new and improved Projects dashboard. To do that, simply log into the OVP and navigate to the Analytics tab at the top. Click on Projects, and you’re ready to start analyzing.
You may have noticed that not all dashboards have been updated just yet. You can learn more about why we’re updating the dashboards one by one and what updates you can look forward to in this interview with our product owner, Tom.
Next up is the advertising analytics dashboard–Be on the lookout for another update soon!