Your video has gotten over a million views. Well, then it must have been a success, right? But how do you actually measure the real ROI of online video? And how can you optimize your online video strategy? A lot of companies use the number of views as a metric for their success, but are they enough to draw this conclusion?
While online video is taking off, online video metrics aren’t…
Strategic deployment of online video is familiar to most companies. However, it seems like something is missing and the number of views are not delivering the full ROI you would like; for example, a higher customer satisfaction or a better conversion rate. So, how can we draw the right conclusions that give us the information we need to achieve our goals? Right. Video optimization based on online video analytics. Only continuous analyzing and optimizing can realize the best results for online video.
Five essential video metrics to measure the success of your content
Let’s look at the basics that video metrics offer. There are various online video metrics available depending on the platform(s) you use. Some of the most common analytics will be highlighted below.
1. View count
Online video metrics are used to measure the success of online video. This often starts with the simplest statistic, which is the number of views. Although they certainly give you some insights into the results, they do pose a problem. The difficulty with this data is that the findability and the use of communication channels, as well as the timing and the size of your target group influence views.
If you are only focussing on views, it is impossible to draw the right conclusion. However, if you combine this statistic with the average viewing percentage, there is a good chance that you will gain the right insights. The average viewing percentage will give you insight into the time your viewers spend watching your video.
When the average viewing percentage is low, it seems like the content is not interesting enough for your viewers. When the average viewing percentage is high, you can draw the conclusion that the video is difficult to find.
2. (Average) viewing percentage and completion rate
The average viewing percentage displays how much time the viewer spends watching a video. This data gives you information about the attractiveness of your video. If, for example, a two-minute video shows an average viewing percentage of 10% (12 seconds) then you know that the first few seconds aren’t compelling enough to keep the viewer watching. In this case it might be a good idea to question if your target group cares about the content.
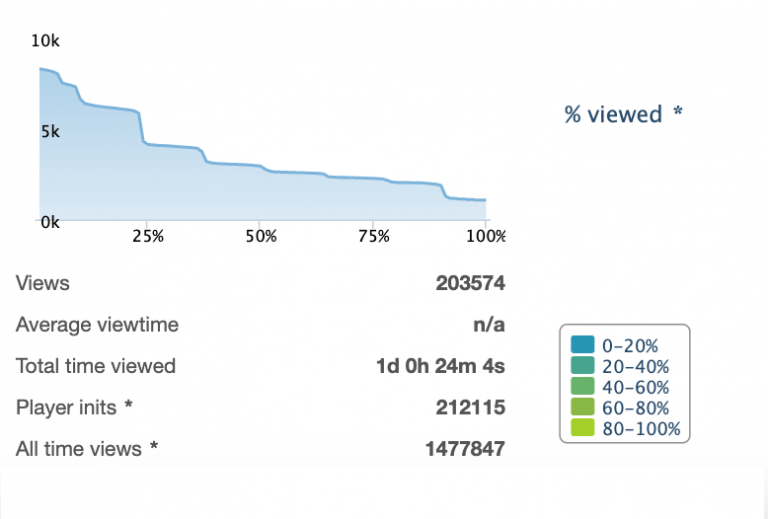
You can also take a more detailed look at the specific time that the viewers drop out (display duration or viewers loyalty). If you do this, you can determine where the most viewers drop out.

The example in the graph shows that a lot of the viewers stop watching around 10%. This could be caused by several factors. Maybe the introduction is too long or perhaps the title of your video is misleading. Based on your online video metrics you can then decide to optimise your video content.
3. Engagement
Another interesting metric is engagement. This might sound simple, but it is often forgotten when it comes to publishing videos on your own website. If this is one of the goals of your video, you should offer the possibility to express engagement. For example, by giving viewers the opportunity to react, share and click.
When you get a lot of reactions, you can conclude that the video appeals to your audience. This does not mean that all reactions are positive. High engagement can also come from negative reactions. Considering that this is not the goal you wish to achieve, it is important to also analyse the sentiment in reactions and use the feedback to optimize content.
4. Demographic
Included in your online video metrics is the demographic, which tells you where viewers are located. This is also called geomapping. Geomapping will give you information on your reach.
You only reach a small part of your target region, because the various regions use different communication channels or are located in a different time zone. In this case, it can be useful to tailor the communication channels and timing to the regions you want to reach.
You can also get more insight into what devices your target audience uses to watch your video content. This information can help to optimize videos for specific devices. For example: when a video is mostly watched on tablets and smartphones, it is useful to use larger text and buttons.
5. Conversions
Last, but not least, it’s important to see what your videos have actually earned. You can see this in your video metrics by looking at click-through rates, people who filled out a form or people who made an actual purchase.

These metrics are available if you add a CTA or a form to your video. If this isn’t an option, you can also add a CTA or form to the video landing page. Next, compare the analytics of your video with your website analytics to see what effect the video has on your conversion rate.
When you notice that the number of conversions or clicks are not increasing, you can try to focus the viewer’s attention on the CTA or the form. For example, by letting it appear in the video more that once or by mentioning it in the voice-over.
Use online video metrics to optimize your content
For all online video metrics named above: the outcome will become more trust worthy once you publish more videos. More videos allow more opportunities for comparison between various videos. By looking at video statistics more closely, it learns you more about how to achieve your goals. You will also gain knowledge about target groups and on how to improve your video strategy. Time to gather some new insights and start optimizing!


