Creating an interactive video can be quite the project; setting up goals and KPIs, drawing out the various steps and paths in a flowchart and measuring these steps right down to the click. To make this whole process a lot easier we created the Projects Module. And now it has been improved to be able to help you gain all the insight you desire and to find out how well your video strategy is doing. We present to you: OVP7.
Get creative with the Flowchart Editor
One of the first steps of creating a video is the script. An interactive video comes with its own type of script: a flowchart. Thanks to the brand new Flowchart Editor there is no more need for pencils and markers.
It has never been easier to create a flowchart. Within the Flowchart Editor you can drag and drop the various steps right into place and add the relevant clip to each step. This way you can visualize your ideas and share them with colleagues.
Get a sneak peek of the Flowchart Editor in the video below.
Set up KPIs
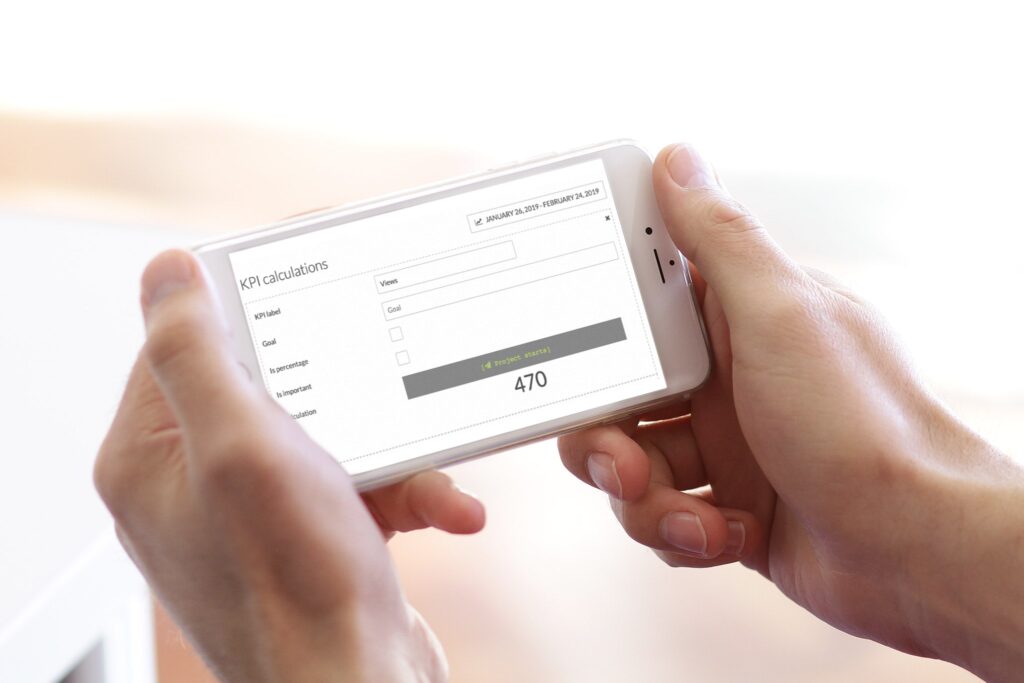
When you create a video, you also have a goal in mind. Whether its a conversion rate of 10% or a completion rate of 90%; you want your video to deliver. Now you can add these KPIs immediately to your Project. Just add a KPI label and set the bar. The KPI calculator will do the rest and the results will pop up in the Performance tab.
Prepare your video distribution with Checklist
You created a flowchart, set your KPIs and chose your thumbnail. What’s next? With the Checklist you know exactly when your video is ready to go live. Make sure you tick all the boxes and hit publish.
Gain insight with Project Analytics
We love numbers, but we realize that not everyone does. That’s why Project Analytics was build. The Flow Analysis gives you a visual overview of how your projects are doing. See how your viewers navigate through the video step by step, what parts are performing well and where there might be room for optimization.
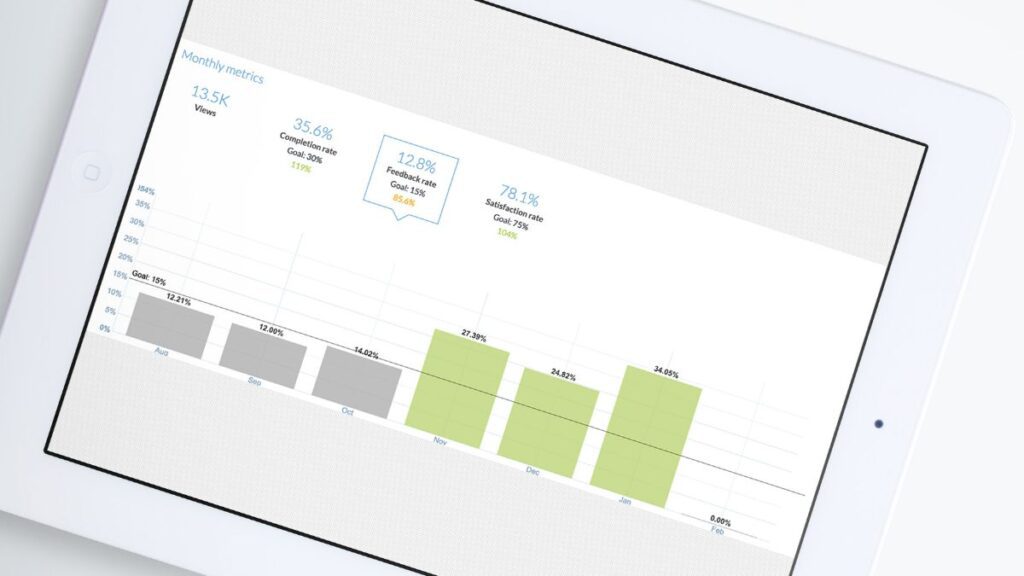
And that’s not all: check out the Performance tab. Here you will see all of your KPI’s and whether you are nailing those goals you set at the beginning of your interactive project. You can even set up a report that you can have sent automatically to any email address. No more maths needed!
Need help getting started?
Contact one of our Customer Success Managers or attend the Blue Billywig Essentials Training.

Want to learn more? Explore our other updates

Find out how our platform can support your video strategy
Fill out the form and one of our video experts will happily show you around our platform and answer any questions you might have.